Andrew Ang, Robert J. Hodrick, Yuhang Xing, Xiaoyan Zhang. "The Cross-Section of Volatility and Expected Returns." Journal of Finance (2006): 259-299.
In this paper, the authors seek to examine the effects of aggregate volatility on the cross section of stock returns. They hypothesize that while the time-series relation of volatility and expected market return has been thoroughly researched, further consideration with respect to the cross section of stock returns should show that the volatility of the market return is a systematic risk factor and should be priced in the cross section of stock returns. With this, they then suggest that stocks with different sensitivities to aggregate volatility innovations should have different expected returns. To test this hypothesis, the authors look to show whether the aggregate market volatility is a priced risk factor and, if so, determine the price of this factor. They also examine the cross-sectional relationship between idiosyncratic volatility and expected returns to test whether such a risk factor is orthogonal to existing factors.
Theoretical Motivation
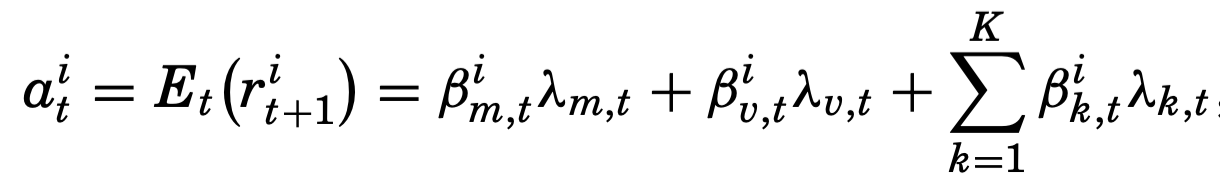
The model that they look to test is of the following form,

where (in order from left to right) the loading on the excess market return, asset sensitivity to volatility risk, and loadings of K other factors are regressed on excess stock returns.
They then simplify the above to arrive at the following with respect to expected returns,
Empirical Test
Because we do not yet know the true set of risk factors and, as a result, cannot observe such loadings of factors, the authors design a practical empirical framework to test their hypothesis.
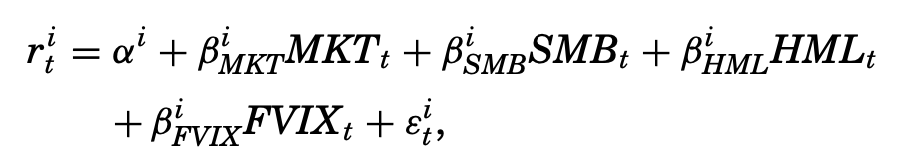
As a measure of innovations in aggregate volatility, the authors use daily changes in the VIX index. This is represented in their pre-formation regression,
which is used to test the difference in average returns of stocks with different sensitivities to innovations in aggregate volatility. Quintile portfolios are made by sorting from lowest to highest the regressed results of the loadings on the volatility factor. The stocks of each portfolio are then value-weighted. They measure the difference of average returns between portfolios with the highest and lowest volatility coefficients and find a difference of -1.04% per month that is statistically significant at the 1% level. This can be seen in the mean column of Table 1 below,

Factor Risk Explanation
The authors then look to create a factor from aggregate volatility innovations to suggest a factor risk-based explanation for the above results. This factor, called FVIX, is then used to measure ex post exposure to aggregate volatility risk. The following regression is used for the creation of FVIX by estimating the coefficient of the returns on the base assets X,
where the previous quintile portfolios are used for the base assets.
After constructing FVIX, the authors then substitute FVIX for the daily change in VIX in their pre-formation regression to get the following cross-sectional regression,
however, to test this model a contemporaneous relationship between factor loadings and average returns must be shown. The authors do this by observing that the pre-formation FVIX factor loadings and pre-formation VIX factor loadings are very similar. This can be seen in the second panel of Table 1 as follows,

Post-formation factor loadings are also shown in Table 1. It is the full sample post-formation FVIX betas that are then used to examine ex post factor exposure to aggregate volatility risk. To control for market, size, and value factors from the Fama French 3 Factor model, the authors use the following regression,
From Table 1, it can be seen that the full sample post-formation loadings on FVIX are significantly different across the quintile portfolios.
Pricing Aggregate Volatility Risk
The full regression specification used to estimate the unconditional price of the aggregate volatility risk fact is as follows,

which includes momentum and liquidity factors UMD and LIQ, respectively.
The Fama-MacBeth regression results of the above are,

Regression I from above shows the estimated price of volatility risk is -0.08% per month. The effects of volatility can be measured by multiplying the -0.08 from above with the 13.13 ex post spread in FVIX betas from Table 1. This results in a difference in average returns of -1.05%, which is almost the same as the -1.04% difference in the raw average returns, suggesting the difference in raw average returns can be attributed to exposure to aggregate volatility risk.
Idiosyncratic Volatility
The authors then sort portfolios by idiosyncratic volatility to observe its effects on cross-sectional average returns. They define idiosyncratic volatility relative to the Fama French 3 Factor model as the square root of the variance of the residual. This is to control for systematic risk, however, they also sort portfolios by total volatility. As seen by Table VI below, average returns for portfolios sorted by total volatility and idiosyncratic volatility are very similar and the difference in highest and lowest volatility portfolios are statistically significant.

Robustness tests suggest these results cannot be explained by exposures to size, book-to-market, leverage, liquidity, volume, turnover, bid-ask spreads, coskewness, or dispersion in analysts' forecasts characteristics.
Conclusion
The authors conclude that aggregate market volatility is a risk factor that can be observed in the cross-section of stock returns, and that the price of this risk factor is negative and statistically significant.


